Executive Portfolio Management using the SEE Lenses

First let’s ensure how I am looking at portfolio management is understood. I’ll use this fairly common definition: it’s the oversight of a set of investments being made for meeting a set of objectives. Since we’re dealing with a set of investments, there are a few lenses that we can apply to view them. This post will take a look at the first of a few lenses we can use to develop suitable metrics.

The first lens is what I’ll call the SEE lens. It stands for sustainability, effectiveness, and efficiency. Just to give you an understanding of where future posts will go, I’ll review the other lenses.

The second lens is one of where an investment is in its life-cycle; is it a new product or service, one that is being matured (i.e. trying to be grown), is it mature, or is it one that the organization is retiring? The third lens I’ll call a spatial lens and is tied to either market segments or geography. You could apply both, but I’d be careful to ensure that the delineation is needed. BTW, geography doesn’t have to be what we generally think of regions, countries, et cetera. It may be more appropriate in some cases to look at this by a slicing of rural, urban, and suburban or maybe along climates; it will depend on the investment. A fourth lens may be around the technology or skills used. Again, in this post, I am only going to deal with the SEE lens. In future posts, I’ll focus on other lenses.

The sustainability lens is how well can I keep this investment going. This is probably your most important lens as it the other lens assume some level of sustainment. Useful metrics are around employee morale and customer relationships. You might measure employee morale with job satisfaction surveys or happiness indices. You can also look at overtime as an indicator (especially if the job is salaried, not hourly wage).

For knowledge work, I would suggest setting up measurements in how people feel they have meaning within the work they do, feel responsible for the outcomes their work has, and the ability to know the results of their work. These are the three critical psychological states as defined by Hackman and Oldman. If any of these start to dip, we have some indicators in what we can do to help get them back on track by looking at how jobs are designed. We can also gather metrics on factors that contribute to group effectiveness from the organizational context or interpersonal processes.

For customer satisfaction, we can looks at a net promoter score (NPS) as one easy to gather metric; the issue is that it may not reveal the exact nature of any problem if it slips. Customer referrals would be the realization of a high NPS; the organization is actually getting others recommending them, not just saying they will. Another metric around renewals or repeat sales also can help measure this satisfaction. Lastly, you could look at the inverse of satisfaction, the level of complaints leveled as another metric.

The sustainability lens metrics lead effectiveness and efficiency metrics. When these slip in undesirable directions, you will get problems appearing later in the others.

Our second lens is the effectiveness lens. It is is second in importance after sustainability. Why? Well without sustainment, your effectiveness becomes irrelevant and being efficient is meaningless if you aren’t being effective.

Effectiveness is highly dependent on the mission of the organization. For commercial companies, sales, revenue, and market are applicable to this lens. I would suggest that finding a metric that indicates alignment in market fit would also be beneficial. For a services organization, this might be how well are you doing to solve a customer’s problem or are you providing the right talent for helping the customer perform their mission. Product companies usually focus on their position in the market, finding ways to measure this based on product features. For non-profit or public institutions, this will be totally aligned with what your organization is chartered to do.

One thing to be careful is doing comparisons with other products or services as your means of measuring. That will only tell you how effective you are in relative terms, not in a concrete manner. It’s not that comparisons aren’t useful, but let’s say your market fit is how well you can transport people between different points at a specific cost. If you only used comparisons to others that did this in a similar manner, you might then find that you can’t see a potential disruptive approach to this because of the comparative view. If you used a more concrete metric that didn’t rely on comparisons, then you can look for ways yourself to improve this metric irregardless of competition.

Some product quality metrics also are within the effectiveness lens. Market fit is a form of quality metric. Other factors might be reliability, usability, or security; knowing which are applicable to your product or service can help you find the right metrics to measure in these.

Efficiency is the last lens. Metrics you may use within this lens are profit margins, time to market, wastes in production, production costs, or labor time. If the organization services the products it produces, finding a quality metric around maintainability like mean time to repair may fit here as well.

I hope this gives you a start in how you can start looking for metrics that can help your organization.

Planning Events with Covid-19

I’m going to go a bit ‘off-topic’ from my typical Agile, Leadership, Lean, Software, etc. topics and try and provide some information that may help people in these communities. With so many states starting to open up businesses and such, you may be wondering how you can decide when you can plan your conference or meet-up to start meeting in-person again.

So we’re going to focus on a formula that George Mason economics professor Alex Tabarrok wrote. You can find the details behind this at his post COVID-19 Event Risk Assessment Planner. This assessment planner focuses on the US population in its risk assessment. One of my primary concerns is to help people that plan regional events and meet-ups.

Stand by, we’re going to be doing some math….

In that article, there is a formula:

1-1(1 – c/p)^g

from COVID-19 Event Risk Planner by Professor Alex Tabarrok

Where c = the number of people carrying the disease, p = the population, and g = the group size planned for the event.

He has a nifty graph also that shows this for the US. (Though we now have gone off the scale on the left hand side, so it would be worth extending it.) Note that this is a logarithmic graph, so I’d recommend recreating it on logarithmic graph paper.

When planning a regional event like a meet-up though a calculation at the US level (or any other country) is probably inappropriate. Here is how you can extend that to a regional view…

I am going to do some calculations based on two meet-up groups here in Virginia as a start. First is the Games for Agility, Learning, and Engagement (GALE) meet-up we hold at Excella. It is based in Arlington, VA and draws people from a few surrounding counties and cities (DC, Alexandria, and Fairfax County mostly). [Note: I’ll show what happens if I add in Montgomery County in a moment.]

So first I need to know the populations. Some googling gives me the following:

City or CountyPopulation
Arlington237,000
Alexandria144,000
DC702,000
Fairfax1,010,000

These numbers were from 2019 projections taken through google search results and rounded up to the nearest 1000. These should be good enough… So the total population about is 2.093 million. We’ll set that aside for now…

Next we need to figure out the number of carriers. For this I am going to turn to the wonderful graphics from the Data Wrapper page on 17 (or so) responsible live visualizations about the coronavirus, for you to use and in particular the map portrayal titled: Number of confirmed COVID–19 cases in US counties. (You will need to scroll down about 2/3 the page – the page has lots of graphics on it, so expect it to load a little slow.) I’ll zoom in a bit and scroll over to Virginia.) This data gets pulled daily from a set of data at Johns Hopkins University.

We’ll pull the ratio that reflects the ratio of the population that is infected. I could pull just the number known I suppose, but it states that number has or had, which means it includes deaths (people no longer around) and recovered (people who no longer have the disease). I get this by hovering over the appropriate dot. So here is an example:

Let’s add this information to our table:

CountyPopulationRatioCalculated
Carriers
Arlington237,0001:1801317
Alexandria144,0001:150960
DC702,0001:1205850
Fairfax1,010,0001:2204591

This makes the total number of carriers we’ll use as 12,718.

We need one more number before we can run the numbers through the formula. The size of the group. So using GALE first as our example. Our largest in-person meet-up size was 16 (we’re a small niche interest….). This goes in for the g in the formula, which you will observe is a factorial. As Alex writes in his Risk Assessment Planning post, this is the biggest factor in determining risk as it is bringing people from the population that has been exposed together.

Running the numbers…

1-1(1-12718/2093000)^16=.092… or about 9%

So if I ran GALE today, there is an almost 1 in 10 chance someone in the crowd would be bringing the disease (unknowingly) into the meet-up group. Personally, I’d want this to be below 1 in 500 (0.2%) before I’d feel comfortable (that’s a meet-up group of 3 in case you are wondering).

Let’s now look at how the DC-Scrum User’s Group would look. They regularly have 50 people showing…

1-1(1-12718/2093000)^50=.262… or about 26%

This means they have better than a 1 in 4 chance. Yikes! But wait, they regularly pull people in from Montgomery county, MD also. Mongomery county’s population is 1,051,000 with an infection rate currently of 1:170. This yields an additional 6182 carriers. So for the same size group the formula looks like…

1-1(1-18900/3144000)^50=.260… or still about 26%

Not much change. But if 60 people decided to come I’m now at about 30% chance of someone being a carrier.

If you are deciding to restart your in-person meet-up, the guidance I would advise on this is to cap the maximum number of attendees AND be transparent on the percent chance someone would be a carrier. (If you could set-up the meet-up such that it had social distance as a part of it and perhaps specified masks you might be able to allow a slightly higher risk than what the numbers may indicate as the formula isn’t factoring those things in.

If I were planning a multi-state regional event, I would use the population and ratios of the states attendees would be coming from… plus the ratios of the counties or cities of where speakers were coming from… if different from the attendees. So for example, Agile & Beyond frequently gets attendees from not only Michigan, but also Ohio, Pennsylvania, Ontario, Indiana, and Illinois. I’ve spoken at Agile & Beyond (so factor in Fairfax County, VA if I am selected); so has George Dinwiddie, so factor in his county as well.

I’d consider at this point calculating a straight average of the infection ratio and throw out any that were outside a significant factor different. Example, all my ratios are between 1/120 and 1/330, but two speakers come from places where ratios are 1/2730 and 1/1850; I would throw these low ratios out. I would not throw out an outlier at a higher ratio. This averaging with throwing these out would actually bias it to be conservative and thus safer for everyone.

For international events, you can use the countries from where people are attending.

How can we project when we can return to in-person events? The COVID-19 tracker at Virginia Department of Health provides a hint. If you look at the Number of cases by event date graph it is showing a downward trend, but we need this graph with the total number of infections in the population, not by event (which is a daily number). Then one can use the rolling average on the rate of change over say 3-7 days to project how the # of carriers will change. Perhaps you could do this with the number of daily events; I just don’t feel comfortable with that projection as the disease persists and daily events are more sensitive to social distancing, business closures, and other lockdown policies.

Another place to keep your eyes on is the Institute for Health Metrics and Evaluation (IHME.org), they are the organization producing the models that forecast deaths, hospital usage, etc. and these take into account changes in patterns of mobility and social distancing. Hopefully we’ll start seeing some additional projections of rates of changes in infection rates actually being produced.

I hope this is helpful for people that are trying to figure out when and how to plan in-person events again.

Management: Accept Feedback to Clear Your Blindspots

Pair of clouded eyes

I am working with an organization that has many teams that report up through a couple of layers of management. The teams happen to be contracted, though for other organizations I have not seen it make a difference. The management, particularly the higher level of this management, does not seek feedback for the decisions they make or that they are making.

If you are a manager, it is important for you to get feedback on the options you have for the decisions at hand. This will help you know if other options can be considered and to understand the impact of the decisions you are making. The amount and type of feedback you request is important. Without this feedback, you may be making decisions in the blind. When you make them without seeking feedback, you are missing information on whether your choices will have a positive or negative impact on the people doing the work.

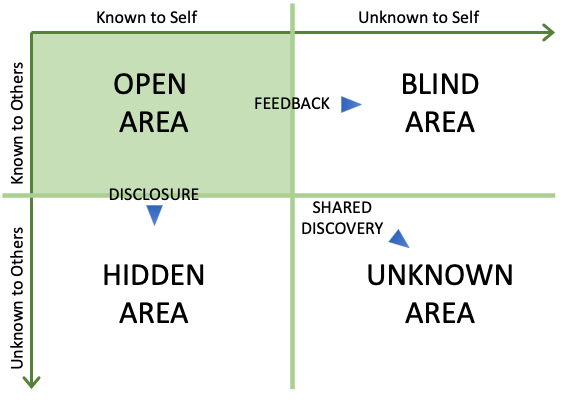
Before we dive into an example, let’s look at a long-standing model of people and knowledge about interpersonal awareness. The model displayed below is called the Johari window. It was first presented in a paper in 1955, but was really fleshed out further in a book called Of Human Interaction by Joseph Luft in 1969.

The Johari Window*

There are things you and others know about you; this is the open area. You know some things about yourself, but others don’t. This is the hidden area. You can choose to disclose what you want. There are areas unknown to both you and others, this is the unknown area and shared discovery is how they become known. The important area for this post is the blind area. This is an area others can see about you; they know the information AND you don’t. The way you discover this is through feedback.

This feedback could be solicited (you ask for it) or unsolicited (you didn’t). I don’t recommend anyone give unsolicited feedback; it’s best to ask if someone is interested in receiving it.

As a manager, you need to be open to receiving and asking for feedback from others (yes including people that report to you) for several reasons:

  1. It models this behavior for others; if you would like people open to receiving feedback from you, then you need to lead by example.
  2. This is a mechanism in how you determine how well you are doing as a manager. Getting regular feedback, both formally and informally, from above, below, and your peers gives you a complete picture.
  3. This is also how you can find out if your decisions will impact others negatively. If these happen to be the people that report to you, it may reflect negatively on your performance. You can choose to learn about these negative impacts as you consider the options for decisions or after you made a decision and hear about it from a different path (like your boss or a customer).

I am going to run through a short example of why it is important to ask for feedback on decisions. This is an extremely simple example.

Imagine you have 20 or so teams that suddenly started going remote due to COVID-19. The week after everyone went remote you held an all-hands meeting of all your staff and contractors (so everyone involved in those 20 or so teams and then some) and you gave them some information about going remote and wanting to help create an environment of helping people work together.

It went well enough and so you decide you want have another at some point. 6 1/2 weeks pass and so you schedule the next one in the 3 days. Now remember, everyone reports to you. Teams scramble to accommodate this decree; it has really disrupted what they now have as work rhythms, something they had not acquired one week into going all remote. At that earlier point in time, it was much less of a disruption.

What may have happened if you had for some feedback on this plan from team members with interest in actually learning the impact? It most likely would have revealed it would interfere with planned work. Does this mean you should abandon the idea of having an all-hands? Not at all. What it does do though is open up considerations of when you could schedule it and how much lead-time would allow teams to fit this into their plans more readily.

This all-hands is a simple example. Is the negative impact unrecoverable? Not at all… But the signals it sends are probably worse. It signals that being present to listen to you as the ‘boss’ is more important than the actual work (which was free to being disrupted). This can lower morale. Given you have some layers of management between you and the teams, it also says it is OK for them to do the same. Hmmm… now this effect is multiplying. Most likely you were blind to these effects.

And depending on context how many other seemingly simple decisions are made without soliciting feedback on them before they are made?

Some will claim well ‘Inspect and Adapt’ that is the agile way… That may be true and I would also say that more important in this circumstance is building the project around a motivated team and supporting them. Sincerely reaching out for feedback on this decision (even if you still end up making the same decision) in itself helps reduce the deflated motivation.

* “The Johari window, a graphic model of interpersonal awareness”. Proceedings of the western training laboratory in group development, Joseph Luft, Harrington Ingraham, 1955

SAFe does not equal Safety

So I am working with a client that has decided to implement SAFe across its teams. They want to make their management of multiple applications easier. I have no doubt that from their perspective it is well intentioned. They do not understand it fully and the non inquisitive ‘coaches’ they have hired have no problem imposing it. And this is why I hate SAFe (sorry rant for a bit).

It really has nothing to do with having good ideas. SAFe has lots of them (I wish they gave credit to all those they pulled from – most of their, if not ALL their thoughts are not original.) They have plenty of good ideas baked into the framework. What kills SAFe from a safety standpoint is how much it is a practice mandatory approach. They talk about principles (I’ll get to one that I think is misused momentarily), but in the end, when people they certified execute this stuff, it is all about practices and implementing as stated.

So I have a big qualm in how transparency is described. That principle is used in how management can look into a team. No problems there. So what about the reverse? Can a team know why a decision was made by a product owner/manager or other stakeholder? This is usually not very clear and favors not letting a team know; it is presumed the external authority is more wise than the team.

I know, you’re thinking what is the big deal… Well I am working with an organization that tried SAFe a few years back and dumped it as it lowered its ability to release on demand. It has some minimal ‘gates’ it has imposed; it’s a government organization so it needs some for compliances external to the organization. Yet here comes SAFe and here is how it will do things. The consultants have no inquisitive mind about what is in place currently. When they decide to implement something, they also don’t ask what teams are currently doing. They plough ahead with what is mandated by SAFe.

Given I was asked to coach coaches (that were recognized as being too much by the book), I find it interesting how unresponsive they are to different perspectives on how SAFe ideas can be implemented. We’re going fully virtual, they planned to set up WebEx breakout rooms by team for PI planning. I pointed out that if teams could independently plan in their own room, then we have no need to ‘scale’, perhaps the breakout rooms should be set up as teams identify dependencies. This was brushed aside. Same for how POs should interact with teams. I expect coaches to recognize the need for adaption and to listen to feedback.

Unfortunately, most SAFe consultants (BTW, technically I am one – so disclaimer) seem to not consider the context of the organization, the work systems in place, the actual organizational context that is calling for scaling, and/or the various needs of teams. Why not? SAFe subserves this to the needs of its system of operation.

If you want to implement SAFe successfully, first consider organizational context. Skip their ‘patterns’ and implement the minimal elements you think you need and add or reduce elements on what you discover.

Second, think about the teams you are asking to change their work patterns. Some will go willingly; some won’t. This feedback is a gift, not a pattern of stubbornness to overcome. Perhaps what you perceive as an ROI isn’t as good as what they are offering. Skip the sales message, learn why they think their ROI is what is needed and how can fit into it.

Third, quit treating teams as people you can’t entrust with organizational decisions. This happens predominantly with two things at play: 1) there are incentives to not play nice and 2) the overall organizational goals are not clear and prioritized.

And that brings me to the last point… If at any time you feel you need to do a sales message, ask yourself why. SAFe seems reliant on ‘selling’ its importance. It’s part of the training for god’s sake… If the need is not self-evident, one should think of why an approach is being pushed. I’m not for not using it, but more for understanding true needs and letting it guide us.

See the Scaling Manifesto for more understanding…

Without these considerations, SAFe will not bring safety, something it proclaims,

Retrospective Storytelling, a #RFG19 Session

It’s been a long while since I wrote… Well that is not entirely true; I’ve been writing a considerable amount on Excella’s Insights. It’s about time I returned to a post on my own blog.

I had the honor of attending the Retrospective Facilitator’s Gathering this past week with 19 others. I was invited by my friend George Dinwiddie. He invited me several years ago and checked in most years, but it just never worked out until this year. This is a week long Open Space event that began under Norm Kerth. It’s a wonderful community.

I held a session on Storytelling in Retrospectives. I wasn’t very good at keeping notes as the stories were too good 😉 This is my attempt to capture my memories of the session in the hopes it may help others.

I kicked off the session by establish the purpose of understanding techniques and their uses of storytelling in Retrospectives. I started with sharing how I use Dixit cards. I utilize these beautiful cards in two ways. The first is for check-ins and similarly for quick end-of class/workshop/conferences (that I run) retros where people select a card, share the card they selected and explain why they selected. It gives them a complex metaphor to explain. The longer retros I have run anchor this same selection, explain why, but ask people to go into the details of the card and how they represent what they have encountered over the period of time the retro is covering. I ask the others to listen to this story and capture the pertinent items (positive or negative events/issues) from the storyteller. This has the effect of getting people to truly focus and be present. The storyteller isn’t busy trying to do this capture and there is an interesting side effect; because people have their own points of view, these get captured into their notes. The cards are beautiful and most can be interpreted in both positive and negative ways.

Aino told us how she has used Rory’s Story Cubes to invite people to tell stories in a similar fashion. Kim mentioned that she has also done that and also how she has had people silently draw a story together, this digressed in a bit of how improv can be used to tell a story of a particular event and outcome with half the people being the audience and the other half being participants. For a little humor, while still keeping a storyline, this can be a silent improve. This does indeed lighten things up.

The drawing together reminds me an Art Gallery retro where different people that work together draw/diagram how they see the work processes from their point of view. This was a cool technique I learned at Problem Solving Leadership. You end up effectively telling stories as well.

Ainsley mentioned that storytelling has been a consistent topic that appeared at RFG since the early ones.

Somewhere along the line, I mentioned I like to close retros on occasion with the Hero’s Journey; “Once upon a time…”, “Until…”, “Then…”, “Happily ever after…”. The Until is/are the root-causes that created problems for the team, where the Then is the retrospective’s actions. Only if they put these actions into play can someone see the Happily Ever After part.

As Diana and George arrived in our session they reminded that in many ways, any activity we do is a story being told. Sometimes with data, sometimes by people… And even the arc of the Retrospective creates a story.

Towards the end, I wanted to run an idea I had thought of for a Retrospective. I call this the Newspaper Retro. Newspaper articles tell stories based on facts. So my thoughts were to let people in a retro individually brainstorm onto (probably larger) sticky notes news articles of 1-5 sentences about various aspects of what went well or didn’t go well. Everything should be based on fact. These get categorized the following news sections:

  • Politics are all articles about team collaboration
  • Technology is all about tool usage
  • Business is all about the process
  • Science is about new discoveries or learning the team has made
  • Foreign Affairs is all about things external to the team
  • The Nation is the section devoted to things about management

After the initial creation of stories, the team would come together and combine like stories. This is where multiple perspectives now are coming together. The team would take these similar stories and provide analysis on these stories, collectively writing what they think is happening. Finally, they prioritize the 1-3 that will appear to be on the front page, analyze those as well (if not analyzed because of similarity) and then create the planned elements or experiments that will be done to correct these (or amplify them if they are positive), adding these onto the story.

Final front page stories then wind-up being 1-3 factual statements of the problem, 1-3 sentences of analysis, and 1-3 actions that can be taken. A few other stories later in the newspaper wind up being factual statements and analysis, and most are just factual statements. These would be categorized into the appropriate sections and later retros could review the newspaper in future retros.

The group seemed to like this idea for a retro; just realize it is untested at the point of this writing. If you decide to try this, I’d LOVE to hear how it went! I will be looking for a time to use this, but as we know context is important, so I don’t want to use it with a team where it wouldn’t fit.

Shortly after this, we closed… I am certain I forgot some stuff, so I hope attendees will chime in and remind me of what was forgotten.

Creating and Funding Pipelines of Decisions

In the Lean community, there is much talk about identifying Value Streams. For some organizations, I think this gets hard to understand in practicality. Yes they can identify the end point where a product or service comes out and the first few steps backward are easy and then the complexity of its construction takes over as it enters the more complicated structure of the hierarchy. This is especially true in knowledge work or creative construction of a product as opposed to a manufacturing line.

(Bear with me as I span two metaphors here… Pipeline which is a construct used often around continuous delivery of a value stream. And rivers, which I will use as a construct for decisions being made that flow into one another.)

I would propose the fundamental difference is that what we think of as a pipeline is a set of decisions that get made. Using the decisions, allows an earlier view into the pipeline. If you were to map this out for one pipeline of decisions in the current organization, it may look more like a river with a set of tributaries connected by some canals.  This is because even though the production has been pulled into teams, the earlier decisions get spread across many functions still. Simply put, each pipeline then would be its own river system. The linear model of a pipeline isn’t all that linear when mapped against the current reality of the organization.

Some decisions though are connected within a single river (canals connecting within a single set of tributaries) and some go across multiple rivers. These canals are important to distinguish. We’ll return to them shortly.

Some of these decisions are made very close to or simultaneously in time. Often these are not independent. So as a first act, let’s think where some of these simultaneous, dependent decisions could be grouped. This might become a ‘team’; thus rather than having decisions shown as canals between tributaries, I now have just one stream where these decisions get jointly made.

An example? Sure – deciding on the exact vision, and thus its scope, for a proven need to be worked; this is very easily shaped by how much funding is available. This could be a team of business/mission (need), marketing (when it may be needed by…), IT (this team is the best fit and this is their capacity in terms of throughput), and financial personnel (we can shape the funding in this manner).  This team can set the scope based on funding, throughput, and team capacity and the business (with marketing perhaps), can establish a vision for this congruent with the organizational vision.

Where decisions now truly go across “rivers” become integration points where people need to work together. Some may even be in the early stages. Going back to the previous example. The team that is shaping this need has it as the next #1 priority to be enabled for the organization; the resulting financial decision may impact how the #2 priority may get shaped (worked by another team).

The resulting rivers (representing the full pipeline) aligns teams along the entire pipeline resulting in services or products and now better represents sets of decisions.

If you hadn’t guessed it yet, this is where many of what were the traditional managers fit; they get embedded in these teams to help make decisions for shaping the flow of work as opposed to directing groups in how to do their work. They use the broader knowledge of other value streams to know when new integration points (canals in our metaphor) may be needed between them. They receive retrospective input from teams downstream so they can improve how they make decisions. They also balance between what teams are starting anew to what they may have to maintain.

Based on the size of the portfolio the organization can maintain simultaneously will dictate how many of these teams may be needed. It’s possible a team such as this may shape work for a few pipelines or be a part of just one. The pipeline is based on downstream capacity as represented by throughput.

Views of Estimating and Not Estimating for an Executive

This post was developed in order to give a longer response to Henrik Ebbeskog’s.

https://twitter.com/henebb/status/896404981003296768

My personal response to this tweet is that it represents a one-sided static and unsophisticated view of what a CEO may want. I am going to use this question as launch point to show that a range is possible. Which one may be ‘correct’ is highly dependent on the CEO’s mental models (and motivations), the organization, and the environment in which the organization finds itself. In this post, I am only trying to disprove the hypothesis that the CEO must understand some estimate from a traditional point of view at the beginning of an initiative. I’m also going to explore this from a financial sense, not so much from what a team may do around story points, et cetera, though I will make a short mention of it at the end.

For context that we can work within, the scenario is a SaaS company that provides financial compliance services. The company already has revenues in the high tens of millions of dollars and thus is not a start-up. The CEO is interested potentially expanding into a new market by launching new product services in helping clients monitor environmental compliance.

A Traditional Estimation Mindset

If the CEO is in a traditional estimation mindset, she or he will be interested in knowing as much about the iron triangle’s values of cost, time, and scope as possible. The CEO will turn to marketing (the Chief Marketing Officer if they have one) and ask of them “what are all the environmental compliance monitoring needs, who are our potential customers, and what is the potential revenue for these services?” Before marketing runs off and does this research, the CEO also asks, “how long will it take you to research these, and how much will this research will cost?” These are of course fair enough questions; the CEO wants to know the potential cost of the information before giving a go-ahead and whether it can be done in a reasonable timeframe.

OK, an estimate is made on cost and time (hopefully using historic data if they have it) the answer sounds reasonable to the CEO, so the green light to proceed is given. So marketing proceeds with the work they do in order to understand the market space taking about one quarter to do so at roughly $150K; this is on schedule and on budget from the estimate they gave the CEO (1 quarter and $150K+/-$10K; woot! win!). They may research the web on compliance needs, survey companies, see if competitors exist, et cetera. It looks promising; the revenue looks like it will be $10M for the first year, $20M the second year, and an estimated $30M the third year.

Now the CEO turns to the Chief Technical Officer asking, “how long will it take you to build this and when will it be done?” as he hands marketing’s finding on scope to him. Of course the CTO doesn’t give her or him a flippant answer, so the CTO goes back and pulls together a cross-functional team, including an experienced product manager, (let’s assume they have been using Scrum/XP practices for years) and this team defines an MVP with a rough price tag of $225K+/-$50K to get there. They also come up with an estimate of a first marketable release a quarter after that, and (in talking with marketing) another 2 subsequent improvement releases based on prioritized environmental monitoring needs the next two quarters after that for a total cost of $900K+/-$200K. Cool beans! Let’s go!

They execute and for simplicities sake they stay true to their estimate of $900 and $225K per quarter. I want to state that once the team was pulled together, the cost over a time interval is known if it is a stable cross-functional team.

The mindset here is understanding risk before executing (and of course managing it during execution).

A Lean Start-up Mindset

The CEO is interested in exploring the same environmental compliance space. He talks with his other executives and they decide to form a cross-functional team of marketing, which includes an experienced product manager, and IT personnel. They pull together a hypothesis of customer, problem, and solution and identify a set of assumptions about this. The team and executives set a vision for the need and boundary constraints that ensure it stays aligned with the company’s core vision and mission. Within these constraints is a set of questions that if understood state criteria for a transition state to a development effort as it provides enough detail to define an MVP and MMP as well as what the revenue stream for the MMP and other potential known releases of the SaaS product will be. The CMO is appointed as the oversight on this effort and agree that after each assumption is tested he will review whether to proceed, pivot, or kill. It’s worth noting at this point, none of the iron triangle is known. Costs per week of this assigned team are known (just like AFTER marketing provided the estimate above and were told to execute their research).

The first assumption is that monitoring a particular environmental compliance aspect is unserved in the marketplace. The team tries to find evidence of this through market research and a survey to their financial service customers in the same space. It is not disproved, so the CMO gives a proceed (or in start-up terms persevere) signal. They test the next assumption, and then the next. Sometimes, they build a quick prototype to see if a particular compliance rule can be enabled (it was the riskiest assumption). At the end of a quarter and $150K they know what the MVP and MMP look like and what the next 2 releases look like. They have the same revenue stream predicted as the traditional team.

At this point the team is reconfigured to look like the Scrum/XP team above and proceed (however, no estimate is asked for) and we’ll say that they deliver just as the team above costing $900K. The important point is that the same stable cost over the time intervals operates as above. At each quarter a proceed or kill decision is made based on the throughput of work was completed to what remains. This is a form of estimation – yes I realize it. What is different in this case is when the estimate is made; I didn’t start with an estimate. A rougher approach is simply looking at the remaining backlog compared to what’s left. I could also evaluate the marketplace at this point using the competitive analysis approach I had done and see if I want to continue (basing a decision on expected value in terms of a change in potential revenue – another form of estimate).

Other Alternatives

I could choose to do a traditional approach to marketing and then build without the estimate on how much it will cost. I could reverse this and do a lean start-up approach to understanding the market demand and transition to an estimated approach as well.

One thing to note: the lean start-up approach could be modified so that once the MVP (or MMP) was defined, the company could actually start building knowing they have some revenue stream that will come in; they may not know whether the company will get to the revenue stream as predicted though. This would decrease time to market for the MMP and may allow it to even expand into the other markets or it could decide to not and become a complementary service companies purchase.

Take-Aways for the Reader

First, I painted a rosy picture of delivery. It is very likely delivery will not go as smoothly as this. Thus when I reach the end of a quarter where a release is defined, I need to decide whether to continue or not or release with what I have. In a traditional, estimated viewpoint, I am deciding whether to add more time to the schedule (and potentially run over budget as a result) to release with the fully expected scope or release with less scope on time and at budget. Regardless of whether I estimated the length of time it took me or not, I can use my actual throughput of work as the predictor or not on whether to continue. Again, as I mentioned before this is a form of estimation; I am just choosing to do it later.

Second, I didn’t get into estimation that may occur (or not) by the team.

The primary use of story points (or another team estimation method on stories) is to know whether a story is small enough to be completed easily within an iteration. Some teams get really good at understanding their sizing and can stop using story points. (Lunar Logic’s estimation cards are a good insight into this, every story is either a 1 – we can take it on, TFB – too f-ing big, or NFC – no f-ing clue.) I encourage teams to examine the story’s independence and testability to gain this understanding as these two parts of the INVEST criteria are what feed the complexity thinking one needs to understand in applying story points. Teams can still measure throughput and lead time as these can be useful for later questions when an estimate may be needed about ‘how much’ or ‘how long’.

Third, I’d like to change the convo a little a bit. I personally think value and cost are decoupled. Net value (value minus cost aka ROI) are coupled. A great place to get a sense of this is Reinventing Project Management by Shenhar and Dvir. In this book, the authors describe two scenarios where the cost of the project had nothing to do with the end value of what was produced. Another change is ridding ourselves of the use of project thinking when we are doing product efforts. Product life-cycles extend beyond initial delivery and when use project thinking we often short change understanding of both costs and value in the long-term, whether we estimate or not.

Fourth, I hope this gives some insight into when choices can be made about estimation; it is not a simple binary answer, but one of fidelity. In some cases, one will want to run several detailed simulations in order to understand whether an undertaking should be done. In other cases, maybe we can just get started with none what-so-ever. Humans actually never escape mental models of estimation however, even a zero on this range assumes we will get some learning insight that has value and that in itself is an intuitive estimate. We certainly discovered this at the first Agile Dialogues unconference. (Biggest personal disappointment at this unconference is that the person that helped shape the theme then chose not to come after indicating they would.) What the thinking in the #noestimates ‘movement’ is trying to do is change the nature of this and question what our assumptions and beliefs are about what and when to estimate.

I’ll close with saying that there are people that add well to this conversation – they bring in well-formulated opinions. There are others that prefer to provoke – this occurs on both sides unfortunately. I personally seek actual dialogue so we can get out of binary thinking on this (see the Agile Bramble). I point out circumstances where not estimating work not to debate that not estimating is the path to follow, I’ve never said ‘never estimate’, but to have more dialogue of when we should undertake it or not and what we should estimate. Notice I didn’t say ‘if’. I’ve had someone state I evidently had no evidence when I have given some. I’m also not interested in endless debate – ask yourself do you feel you need to ‘win’ an argument. If so, you are not in a mindset for dialogue or learning, but to prove a point.

With this, I hope I have shown that the Rule of 3 applies 🙂


How do you measure sustainable pace?

This was a question posed by my esteemed colleague Bernd Schiffer (@berndschiffer) on Twitter. This is a complicated thing to measure. We all know what effects unsustainable pace has, AND often when they show up, it’s too late. I’m going to divide this post into two segments; first will be early warning signs that a pace may be becoming unsustainable, so you can try and nip it in the bud early. Second will be how to determine that your pace is likely sustainable. (I say likely as it’s always possible these possible metrics may not catch everything.)

Early Warning Signs060417-N-9079D-108

So let’s start with signs that one (most likely a coach or Scrum Master or other suitable servant leader/team facilitator) may use to find out if a team may start to hit an unsustainable pace. None of these on their own may be enough to indicate encroachment of an unsustainable pace, so ensure you get a balanced view.

If you have access to time card data, and if people are honestly reporting their hours, you can look at how the hours they record are trending. This can help you spot both individuals that are undertaking an unsustainable pace as well as the team. This really needs to be complemented with a gemba walk so you know what are normal hours for people and when people may be burning the midnight oil. The occasional late night may be ok; perhaps the individual or team has an interesting problem they want to solve before going home. If this is a regular occurrence, then you most likely have an indicator that an unsustainable pace is starting to happen.

Look at check-in trends. Do they become more rapid in pace at the end of an iteration or before some significant milestone? Do these correlate to an increase in broken builds or failed tests? Does test coverage slip around these? These may be indicators that people are getting rushed in their work. Along with these, trends in escaped defects may also indicate whether a team is receiving pressure to deliver.

If you are running a Niko-Niko or otherwise taking a pulse of the team, then downward dips or loss of stability in happiness may likewise be an indicator that the pace may be becoming unsustainable.

Lastly, consistent carry over of uncompleted work between iterations, measured in story points if you are using them or just in the number of stories, tasks, et cetera, can be an indicator of possibly approaching an unsustainable pace.

None of these on their own though make for a good set of measures, only by cross-correlating them can you possible get a sense of a team’s pace getting to where it may begin to collapse under pressure.

So what should you do? Well if you are seeing these metrics, you will need to 1) confirm that the pace is truly becoming unsustainable and 2) remove the pressure in a manner suitable to getting the desired results. For both of these, sitting down one-on-one and having some conversations as well as conducting some retrospection as a team on what is happening may give more insight than any metrics could. This will also uncover the pressure that is causing it in the first place. The pressure may be appropriate; what may not be appropriate is the reaction. For example, suppose the product owner is not accepting many stories because of a team not meeting all their acceptance criteria. The team decides to begin working late rather than reduce the number of stories they take in as a means for ensuring they get all the acceptance criteria completed. The response is the issue, not the pressure.

Measuring Sustainable PacePressure-Gauge-Pressure-Detection-System-Heat-Meter-161160

With the above, you’d think it perhaps good enough to just look for the absence of those negative signs. Presuming people are truly being open and honest AND also aware of the pace becoming unsustainable then yes, the absence may work. But what if workdays have been regular, but then every so often a few extra hours go in, then suddenly there is a sharp uptick in the number of hours? That may take what was tolerable to intolerable, particularly if it causes stresses between workers where some have family commitments and others don’t and thus get ‘stuck’.

A better measure for maintaining sustainability on a team may be noting how often the team can push back on requests that regularly cause these extra hours. This means the team can choose when they want to do them or not. This is more of an observation. Combined with the Niko-Niko and absence of some of the metrics above, now we may be getting an additional dimension that says the team is working sustainably.

Another dimension can be how well the team honors the Retrospective Prime Directive, not only in retrospectives, but also during standard work. If they aren’t casting work in us vs them or treating other external stakeholders with contempt then the team is probably working sustainably.

And lastly, how often does the team celebrate? Do they take time to appreciate each other? These all are indicators of sustainable pace as well.

As you can tell, it’s probably difficult without an excellent Scrum Master/team facilitator, manager, or Coach paying attention to this.

Observing Human Work Systems – A Coaching Fundamental

The topic of observing people working has caught my interest more ever since I attended the Problem Solving Leadership workshop run by Gerald (Jerry) Weinberg and Esther Derby. At this year’s Agile Coach Camp, I ran a session on this to learn more about what other coaches do to see humans at work as well as share areas I know had learned to start paying attention to…

Our first step was to identify behaviors we observe. Some of the more common ones showed up in our list: work artifacts, conflict, movement, body language, noise levels from people and the environment, and patterns of communication between members (who talks to who).  Others are a bit less common: when people take on leadership, where focus is, and what Jerry calls ‘Jiggling’, an interaction or event that gets a system to change in a meaningful direction from being stuck.

I then had a few people volunteer to observe and select what on the system they wanted to observe. The remainder of the people did an exercise I gave them. After, we debriefed what was observed. One person chose to watch people’s body language and with the exercise focused on when people had eye contact. The other chose to watch for who had control of the pen since it was the primary method for getting work done. Lastly, I chose to focus on who took leadership roles at what time.

Comm_Patterns_Mapping

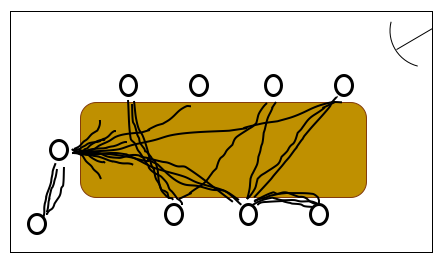
This led to a discussion for understanding how one can observe communications in a meeting and get an idea for who dominates the discussion by drawing lines with who talks to whom and how much. Equal lines with everyone shows little domination while lots of of lines between just a few may show others being ignored. This continued with some discussion around Google’s Project Aristotle and the work of Alex ‘Sandy’ Pentland; here’s a really good paper measuring Face-to-Face communications.

As a follow on, I had the team do a cluster exercise I learned in PSL. I asked the people in the exercise stand next to those with which they most closely worked. This is a very revealing; I’ve done it in a few retrospectives and it can have a team self-reflect on whether they may be isolating others in their work system or if the connections may be wrong to do the work.

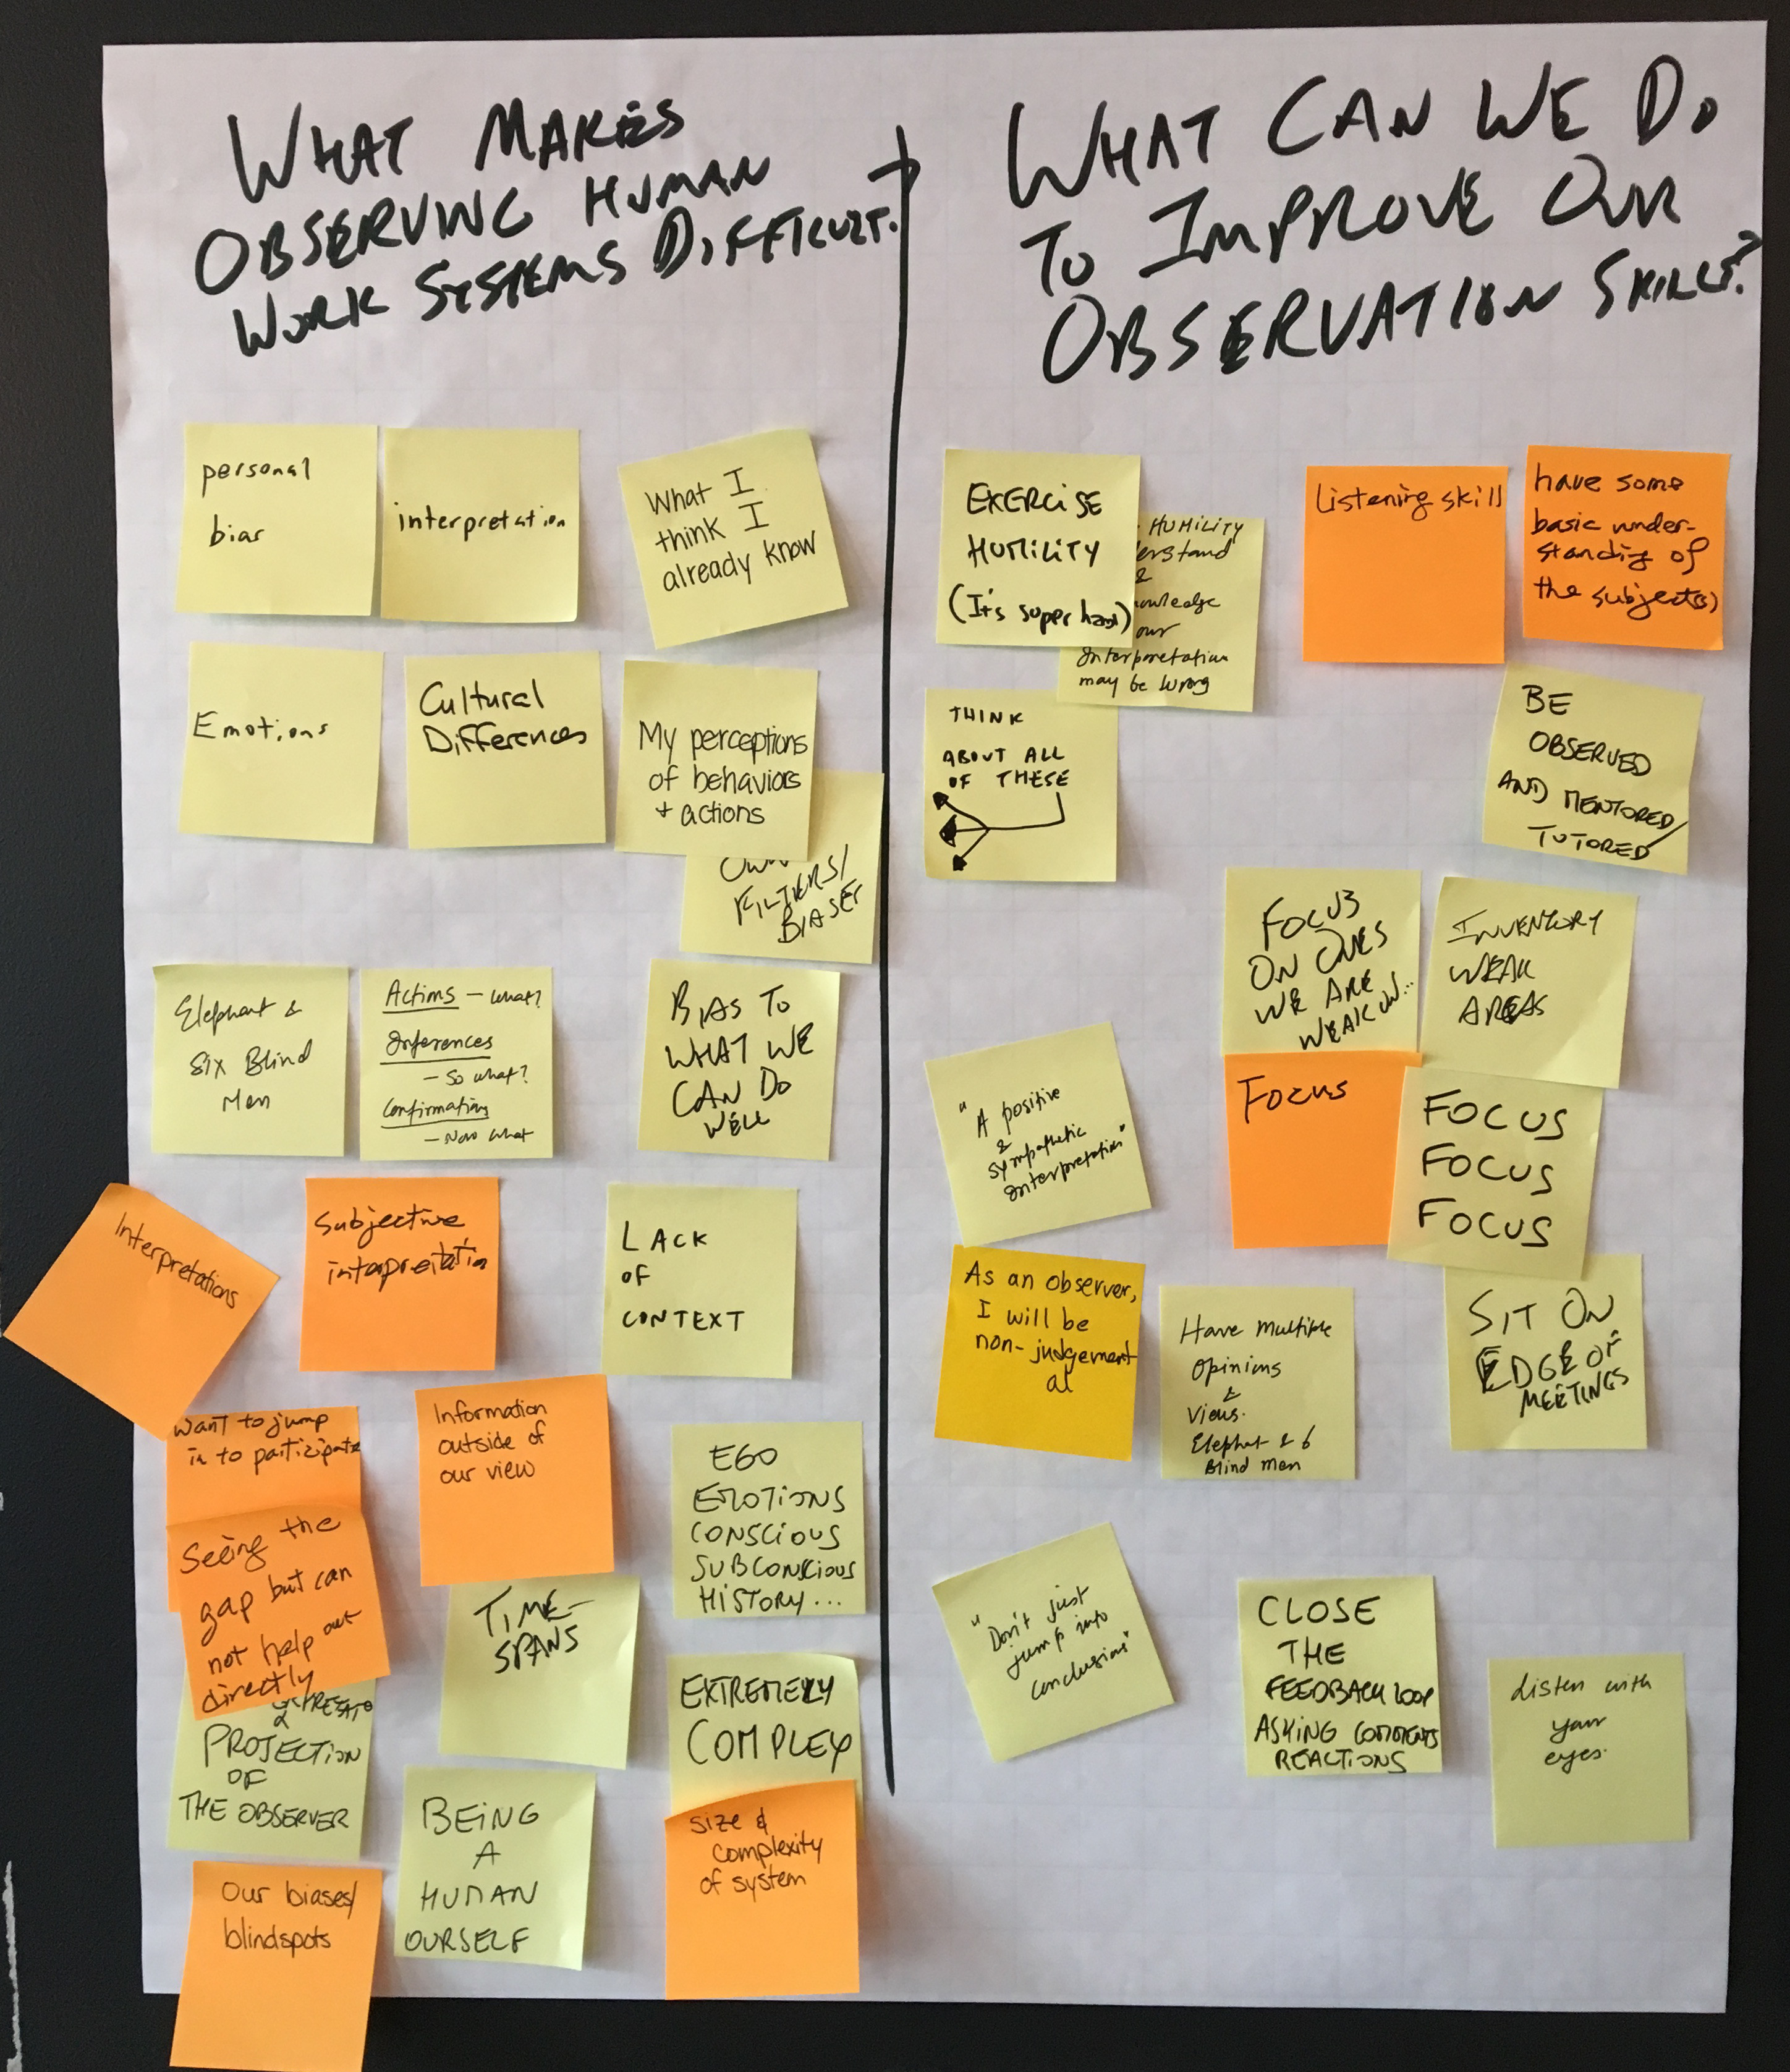
We closed by sharing what made observing work systems difficult and how we may be able to improve this important skill. Below is the photo of the flip chart we took about this…

Last ACCUS Session Last Page

It was great seeing the variety of answers for improving our skills as coaches in this domain. Several mentions of humility were made as well as the core Scrum value of Focus. My favorite comment though was the metaphorical answer to “Listen with Your Eyes” and, of course another was one that hints at cognitive empathy, “have multiple views” to remind us of the Elephant and the Blind Men.

Using Economics to Encourage Testing Incrementally (or As You Go Along)

At TriAgile, I had an interesting conversation with a Product Owner. She described to me a problem where the testers could not keep up and their behaviors were actually holding them back. Let me describe her situation…

In her content development team, they had a couple of testers. They manually tested hyperlinks and other HTML/JavaScript/CSS elements towards the end of the iteration. While she would love to move to automated testing, there were some hurdles to get software approved for use, plus she had this whole behavioral mindset she needed to overcome. The testers on her team felt building and running tests incrementally as a developer completed work on acceptance criteria was wasteful. They preferred to do it after a story was completed by teh content developer; this then always put them being crunched. No matter how hard this Product Owner tried to convince them to do their testing as they go, they resisted. Her Scrum Master was also not providing any influence one way or the other.

As we discussed this at TriAgile, I finally settled on economics to help her understand the situation.

Suppose a content developer produced a defect that prevented a CSS library from working by using a faulty assumption (let’s say it was as simple as a misspelled directory in the URL). And let’s suppose this faulty assumption caused the error to be reproduced 10 times. And further, let’s say each time the person did this, it took them 10 minutes to implement each instance. Lastly, it took the tester 5 minutes to test EACH instance.  So let’s do some math. (All of the times are hypothetical; they could be longer or shorter.)

So first up, testing at the end: 10 x 10 minutes implementation + 10 x 5 minutes testing = 150 minutes. But wait, we now have to fix those errors. So presuming that great information got passed back to the developer and it only takes them 5 min to correct each instance, we need to add: 10 x 5 minutes fix time + 10 x 5 minutes retesting = 100 minutes.  So our total time to get to done is 150 + 100 = 250 minutes to implement, test, correct, and retest the work. Our Product Owner had actually said that this kind of error replication had happened multiple times.

OK, what would have happened if it happened incrementally? Well our implementation time is the same, but after the first implementation occurs it would go to get tested. If an error is found, it goes back to the content developer and having seen the error she or he was making, they can now avoid reproducing it. So the time would be something like this: 1 x 10 minutes implementation + 1 x 5 minutes testing = 15 min, then 1 reworked item x 5 min + 1 item retested x 5 min = 10 min, and finally 9 remaining items x 10 minutes implementation + 9 x 5 minutes testing = 130. Total time now is 160 min.

If the cost was $2/minute (assuming a $120/hour rate employee), you easily wasted

$250 – $160 or $90.

Now multiply this by however many teams are not testing as they go and how many times they have this happen.

Of course there could be items caught that are not recurring, but the fact of the matter is, every recurrence of an error that has to be backed out introduces a lot of waste into the system (defect waste for you Lean/Six Sigma types). Testing as you go and stopping ‘the line’ to prevent future defects from occurring saves money in the long run since labor time is what we are talking about.

In addition to this direct savings as calculated above, one ALSO has the queue time for each test that is awaiting to being tested before it can be OK-ed to produce value. In the first instance, this may be building up considerably, delaying production readiness. And suppose out of the 10 occurrences above, only 8 could be completed because we’re near the end of the iteration? Then we’re probably not going to get all of them tested and any fixes done in time. If we had been testing along the way, then if something didn’t get tested, we could talk with the Product Owner about releasing what was completed and successfully tested. Something of value is completed as opposed to deploying nothing. There is a real opportunity cost for this delay.

So there is something to be learned by each area with this. For the tester, testing completed work, even manually, incrementally keeps you from becoming a bottleneck to producing value. For the developer, giving developed items to the tester incrementally and getting feedback after each item allows you to correct along the way, possibly avoiding future errors. And for the business, having this occur incrementally actually reduces both the real and potential opportunity costs of the work.